From Properties to Metrics
After you've collected data on your projects and teams, it's time to turn the properties into metrics and business insights.
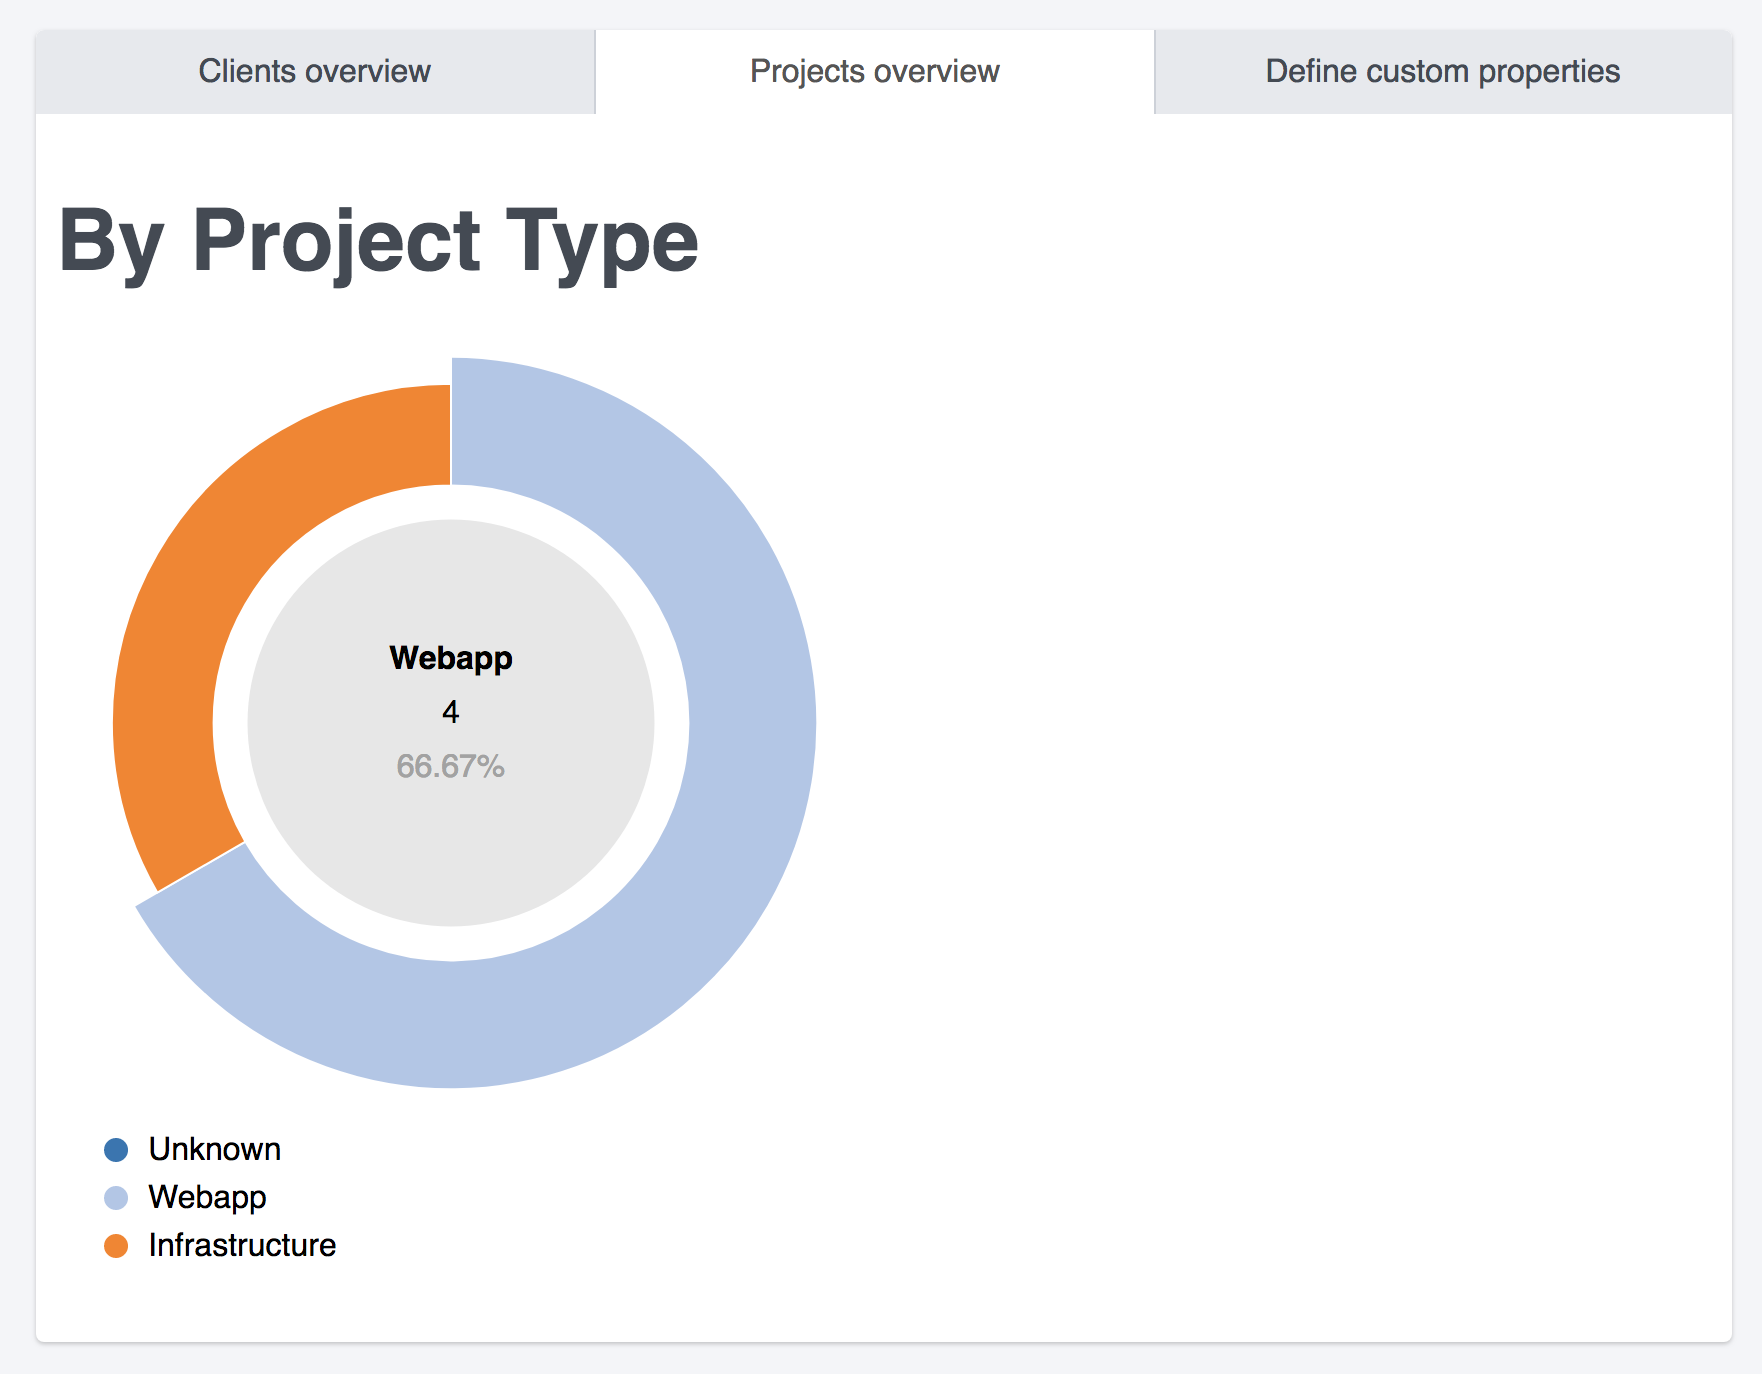
Visualize with overviews
Use the automatically-generated overview charts to get visual insight into the teams and projects on your instance.
A chart will be created for very List custom property you've defined for projects or teams.
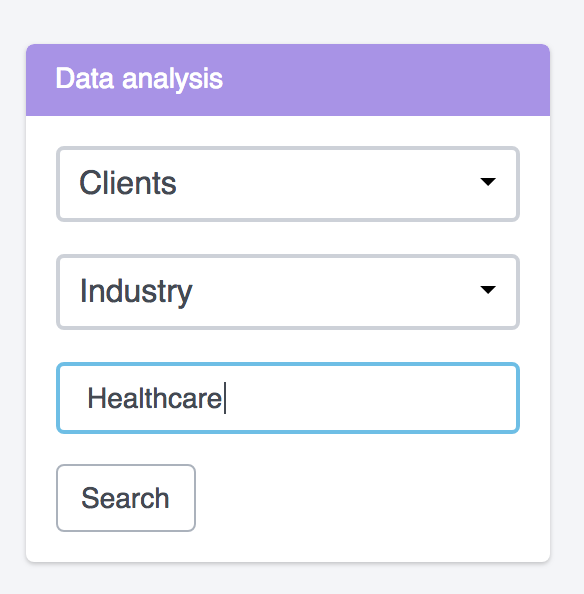
Data Analysis
Use the Data Analysis box in the right hand sidebar to search for and return metrics from your custom team or project properties.
First select whether you're searching team or project properties. Then select the specific property that you want to search. Enter your search value into the box.
In the example below we're searching for all of the teams within the Healthcare industry. Make sure to search for the exact value. In this example, a search for "Health" instead of "Healthcare" wouldn't return any results.
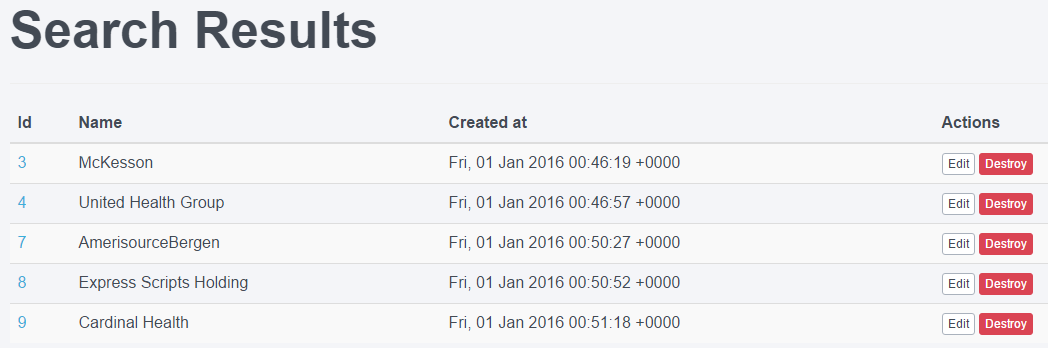
In the example below you can see the search results for the query we set up to search for all of the teams in the healthcare industry.
Next help article: Trend Analysis →